Why Mean Reversion Happens in Financial Markets Daily

Mean reversion is a cornerstone concept in financial markets that explains why prices often swing back toward an average level after a sudden sharp move. Getting a solid handle on this pattern can be a game-changer for traders, investors and analysts alike.
What Exactly Does Mean Reversion Mean?
Mean reversion is the idea that prices tend to drift back to an average level over time, kind of like a stretched rubber band that’s just itching to snap back into place. When a stock price shoots up way higher than usual or takes a nosedive, mean reversion hints that it’ll likely wiggle back toward its normal range rather than hanging out at those wild extremes for too long
- The statistical average (mean) provides a clear snapshot of a typical price level over a specified period and represents the market's standard reference point.
- Prices frequently deviate from this average due to various market forces that influence fluctuations.
- In many cases prices tend to revert or remain close to that average, demonstrating a consistent tendency.
- Mean reversion can occur over diverse time frames ranging from minutes to several months depending on market conditions.
- This concept primarily applies to stocks, commodities, forex and numerous other financial assets and is a reliable tool for traders.
The Historical Background and Roots of Mean Reversion
You know, the idea of mean reversion isn’t just some modern-day financial fad; it’s got deep roots stretching back through history. It’s one of those concepts that’s been quietly influencing traders and economists alike for decades, if not centuries. The basic gist? Prices and returns tend to bounce back toward their long-term average over time. Sounds simple enough, but the story behind it is pretty fascinating when you dive a little deeper.
The idea of mean reversion dates back more than a hundred years to some of the earliest work in finance and statistics. Economist Alfred Cowles in the 1930s took a close look at how stock prices tend to pull themselves back—laying down a pretty important foundation.
What’s Really Behind Mean Reversion in Financial Markets Day In and Day Out?
Mean reversion pops up quite regularly as market forces and human behavior keep nudging prices away from balance points only to pull them back again. It’s like a natural tug-of-war. Various factors such as market inefficiencies, crowd behavior and liquidity chip in and create fluctuations that usually sort themselves out within a short span of time.
- Market overreactions and corrections where investors tend to jump the gun or get a little carried away emotionally when reacting to news.
- Profit-taking behavior with traders eager to lock in their gains after price spikes—they say it is better to be safe than sorry.
- Supply and demand imbalances that can cause prices to wander away from their fair value for a bit, like a boat rocking gently on uneasy water.
- Arbitrage opportunities that tempt traders to capitalize on price differences.
- The role of market makers and liquidity providers, quietly working behind the scenes to keep prices from swinging wildly and help bring some much-needed stability.
Market overreactions often kick in when investors get carried away reacting emotionally to news or rumors. Unexpected curveball events catch everyone off guard. This tends to push prices beyond what the underlying fundamentals really justify. These behavioral quirks cause prices to wander off course for a spell.
Institutional traders like hedge funds and mutual funds often lean on mean reversion to figure out the best moments to jump in or cash out and ride those fleeting price swings. Retail traders chip in as well by tuning into overbought or oversold signals. This not only boosts liquidity but also nudges prices back toward their usual spots. Working in tandem, these groups keep the natural ebb and flow around average prices alive and well like a well-rehearsed dance. Their constant buying and selling smooth out wild price spikes and create a self-correcting rhythm that quietly supports market stability.
The Statistical Basics Behind Mean Reversion A Friendly Primer
Mean reversion rests on some solid statistical ideas like averages and variability. Prices tend to wander around quite randomly, yet somehow they often circle back to a central value over time. Understanding variance and standard deviation really shines a light on why those sharp price swings usually don’t stick around for long.
- The mean gives us the average price over a certain period, like finding the middle of the road on a winding path.
- Variance shows how much those prices wander around the average. Some days they are close, others not.
- Volatility captures the drama of price swings that make variance dance and highlights the rollercoaster moments in the market.
- Random walk theory suggests prices move in a way that feels completely unpredictable yet do not stray beyond certain statistical boundaries.
- Regression toward the mean is the idea that extreme values, whether unusually high or low, tend to return to the average over time.
Price series rarely march in perfect straight lines. Instead they tend to wobble and bob around a calculated average much like a boat on gentle waves. Traders lean on this nugget of wisdom to anticipate potential reversals.
| Date | Asset Price | Deviation from Mean (%) | Reversion Magnitude (%) | Time to Revert (Days) |
|---|---|---|---|---|
| 2024-02-01 | $100 | 0 | 0 | 0 |
| 2024-02-02 | $108 | +8 | -7.2 | 3 |
| 2024-02-03 | $105 | +5 | -4 | 2 |
| 2024-02-04 | $97 | -3 | +3 | 1 |
| 2024-02-05 | $101 | +1 | -1 | 1 |
| 2024-02-06 | $99 | -1 | +1 | 1 |
Frequently Used Indicators and Tools for Mean Reversion The Trader's Go-To Arsenal
Traders often lean on trusty technical indicators to spot mean reversion opportunities. These handy tools measure just how far prices have wandered from their historical averages or highlight when assets seem a bit overbought or oversold
- Bollinger Bands: These measure just how far prices wander from a moving average to flag those unusually high or low levels.
- MACD (Moving Average Convergence Divergence): This signals shifts in momentum that often hint at trend reversals before they happen.
- RSI (Relative Strength Index): It waves a red flag when an asset looks overbought or oversold, nudging you that a pullback might be just around the corner.
- Moving Averages: These smooth out the bumpy ride of price ups and downs, making it easier to spot the trend’s real direction and get a handle on average price levels.
- Z-score: A statistical ace up your sleeve, showing how far prices wander from the average and helping zero in on just the right entry points.
- Mean Reversion Algorithms: These are your automated watchdogs, springing into action whenever prices stray too far from expected ranges according to preset thresholds.
These tools usually give traders a heads-up when prices wander too far from their average or when momentum begins to peter out, hinting that a bounce back is probably just around the corner within the daily timeframe
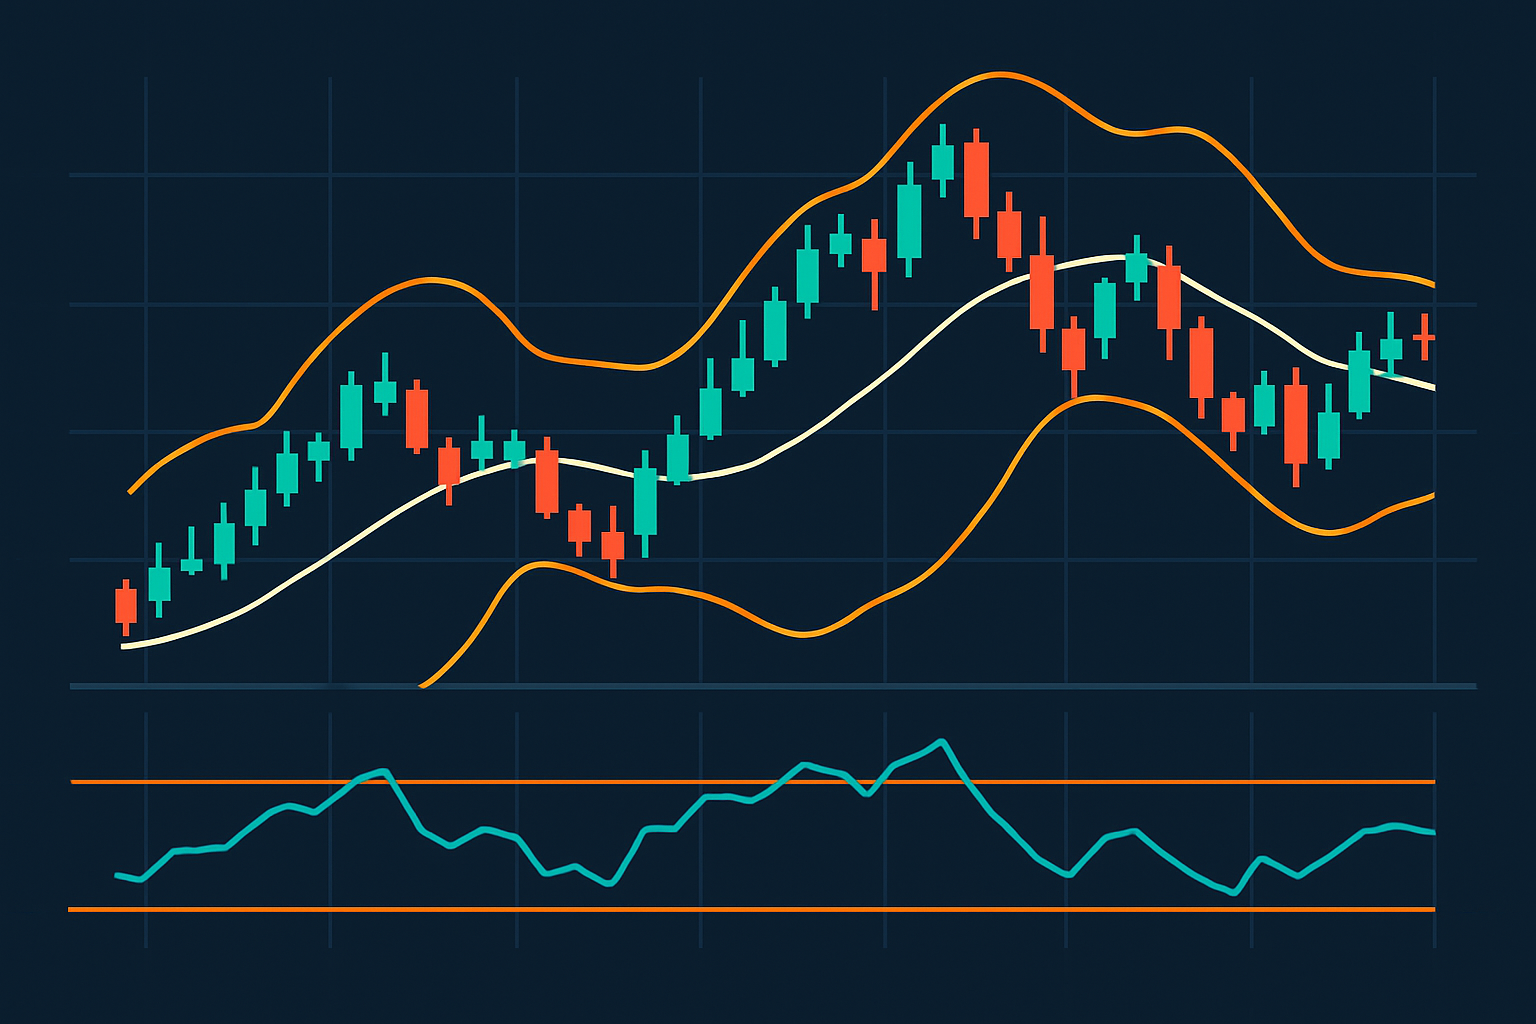
Example of a stock price chart featuring Bollinger Bands and RSI highlighting mean reversion signals
Real-World Examples of Daily Mean Reversion Across Various Markets like a rubber ball after a wild day of trading
Mean reversion pops up across many asset classes. Whether you are looking at stocks, currencies or commodities prices tend to swing away sometimes wildly because of the latest news or the overall market mood but eventually drift back.
- A stock price nudging up about 10 percent above its 20-day moving average and then swinging back down close to that average within a few days.
- A currency pair making a quick dash beyond expected levels then calming down as traders take a more measured second look.
- A commodity like oil shooting up in sharp spikes before gradually returning toward the longer-term average as if recovering from a wild mood swing.
How Traders Often Lean on Mean Reversion in Their Daily Trading Dance
Mean reversion quietly sits at the heart of several trading styles such as scalping, swing trading and algorithmic strategies. Traders often jump on short-term price moves and open or close positions hoping that prices will drift back toward a central level within a few days or trading sessions.
- Take a moment to see if the asset looks overbought or oversold—tools like RSI or Bollinger Bands can be real lifesavers here.
- Hold your horses and wait for confirmation signals like a reversal candle or a noticeable slowdown in momentum—this pause can save you from jumping into a trap.
- When you enter trades, expect a pullback or a gentle nudge back toward the average—nothing wild, just a bit of market ebb and flow.
- Be sure to manage your risk carefully with stop-loss orders and, for goodness’ sake, set profit targets that don’t live in la-la land.
- Exit the trade as the price swings back to the expected average, locking in your gains before the market changes its mind.
Successful traders often emphasize just how vital it is to keep risk management tight, especially to avoid getting caught in those trending markets where mean reversion might throw in the towel. They usually put their strategies through the wringer with thorough testing and try to dodge impulsive trades like the plague.
Common Misunderstandings About Mean Reversion Clearing Up a Few Head-Scratchers
Mean reversion can be surprisingly handy though it’s often misunderstood or taken for granted. It’s no magic wand that guarantees profits, and you won’t see it popping up in every market scenario.
- Mean reversion doesn’t always play by the rules, especially when strong trends come knocking or unexpected events throw a wrench in the works.
- It tends to behave quite differently depending on the market mood and the type of asset you are dealing with.
- Strategies built around mean reversion usually aren’t trying to call the long-term price game—they’re more about the here and now.
- Keeping a close eye on risk is a must because letting it slide can quickly turn things sour with some hefty losses.
- Mean reversion isn’t the same animal as momentum trading, which is more like riding the wave of prices moving forward rather than betting on a U-turn.
Summary Why Mean Reversion Still Holds the Spotlight in Financial Markets Day In and Day Out
Mean reversion is one of those neat concepts that helps make sense of why prices often hover around their usual levels over time. It’s grounded in statistical patterns and typical trader behavior, offering a handy lens to understand day-to-day price movements. Getting a grip on mean reversion can give traders a leg up in crafting strategies, predicting price swings, managing risk, and capitalizing on short-term ups and downs. It’s not a magic bullet and won’t fit every scenario, but keeping it in your back pocket can sharpen your decision-making and boost your trading game. If you are curious to dive deeper and keep your finger on the pulse of industry trends, click here for solid resources and insights.